Unit 4: Functions and Data
At the end of Unit 4, you will be able to (Do) …
C4PI1 Create visual displays, describe key characteristics and determine summary statistics to describe data sets.
C4PI1 Create visual displays, describe key characteristics and determine summary statistics to describe data sets.
Unit Outline
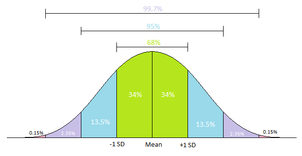
Section 10.1 You will determine association of categorical data that is represented on two-way tables. You will review the differences between graphical representations of single-variable data. Then you will compare the center, shape, spread, and outliers of two distributions. Finally, you will develop a new way to describe the spread called standard deviation.
Section 10.1 You will determine association of categorical data that is represented on two-way tables. You will review the differences between graphical representations of single-variable data. Then you will compare the center, shape, spread, and outliers of two distributions. Finally, you will develop a new way to describe the spread called standard deviation.
Sunday |
Monday |
Tuesday |
Wednesday |
Thursday |
Friday |
Saturday |
Dec 9 |
10 |
11 Investigating data representations |
12 Comparing data |
13 Comparing data |
14 Standard Deviation |
15 |
16 |
17 Standard Deviation |
18 Unit Review |
19 Competency Check #4 |
20 Competency work |
21 Holiday Celebration |
22 |
23 |
24 Christmas Eve |
25 Christmas |
26 No School |
27 No School |
28 No School |
29 |
